DStar / Design Gallery
DStar is an interactive visualization tool that lets you compare, create, and modify your design options (or "alternatives") saved from popular parametric modeling tools such as Grasshopper, Dynamo, and GenerativeComponents.
The high-fidelity prototype contains significant software development, UX design, and the topic of several publications.
DStar is supported by research grants from Bentley Systems and is currently undergoing commercialization.
DStar is designed for multiple, large, high-res displays.
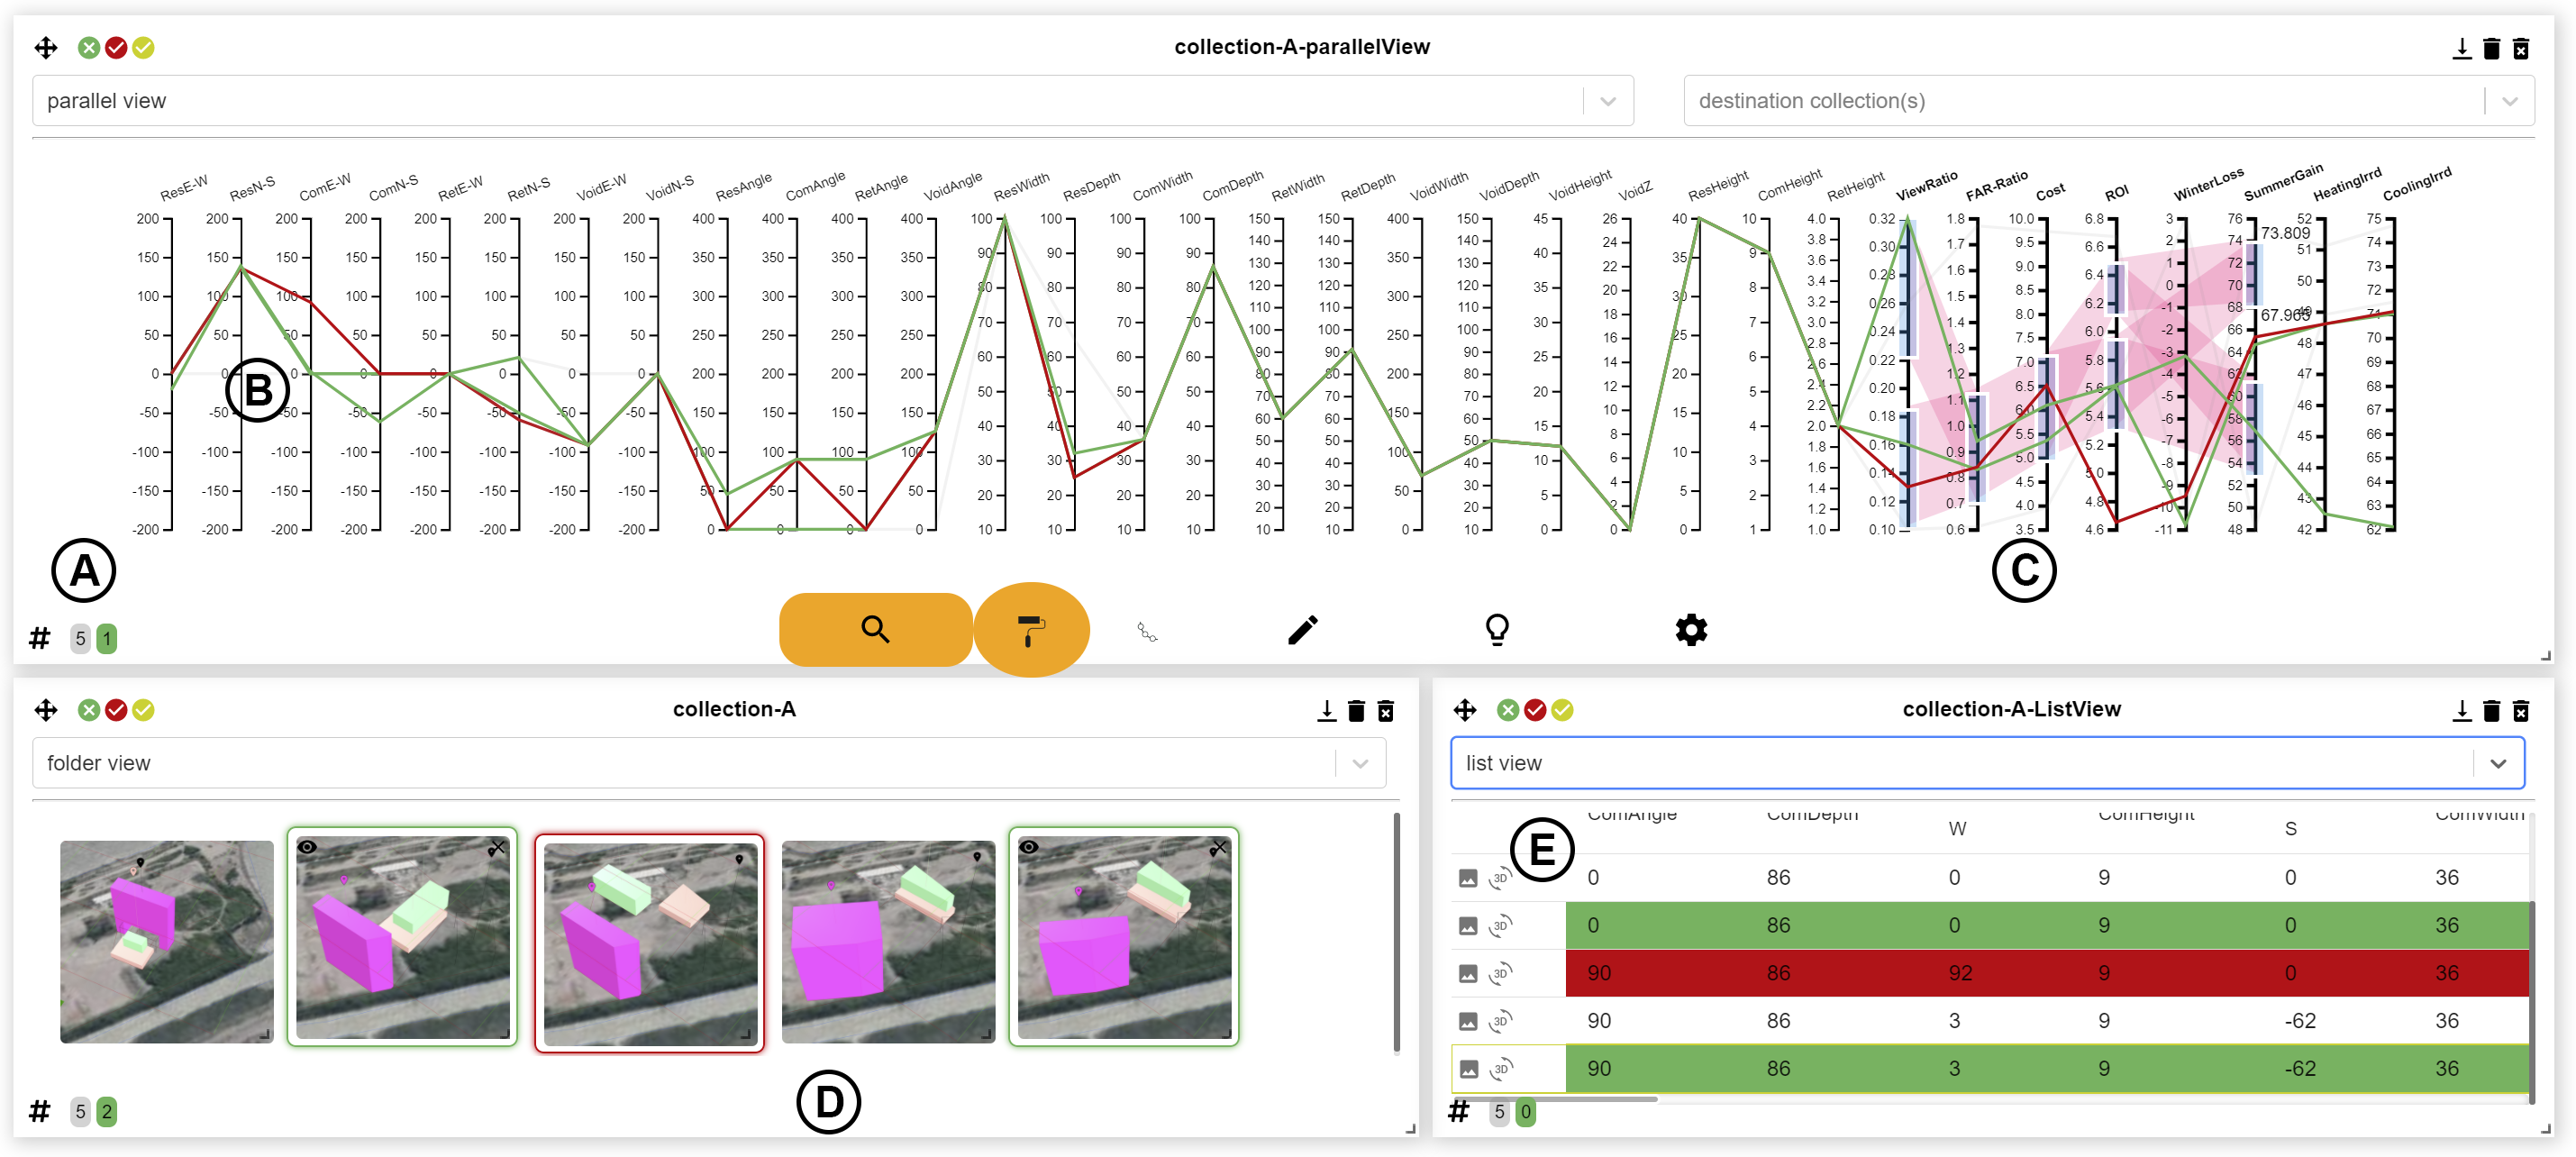
DStar offers three interactive views of the data--
- (A) A parallel coordinate view of five alternatives of a building massing model with 25 input and eight output parameters. Input parameters are to the left.
- (B) Two selected alternatives are in green, a hovered alternative is in red.
- (C) Multi-range brushing.
- (D) Folder view showing alternative thumbnails images which toggle to 3D models. The same alternatives in (A) shown selected and hovered.
- (E) Spreadsheet style list view with the same alternatives selected and hovered. Selections and hovering are coordinated across all views
- Views appear in containers that can be spatially arranged.

- (A) and (B) shows dragging the plots to change input variables. Multiple input variables for multiple alternatives can be edited to compute new results.
- (C) A new alternative can be sketched by drawing a line, or clicking on new values.
- (D) and (E) show sampling strategies, making the interface mixed-initiative.

The software development spans
- A central NodeJS server running MongoDB and an ExpressJS app with a RESTful API
- A front-end in ReactJS with bespoke components for the visualization
- Plug-ins for Grasshopper and Dynamo (written in C#) to send and receive data
- Grasshopper on the cloud to generate options rapidly
DStar is the major focus of my PhD thesis, supported by my wonderful colleagues at the SFU SIAT Computational Design Group led by my PhD supervisor Dr. Robert Woodbury.